Question fréquemment posée
Below are the steps for creating a basic report of sales by customer/category
In Section 1, you will want to select Sales:

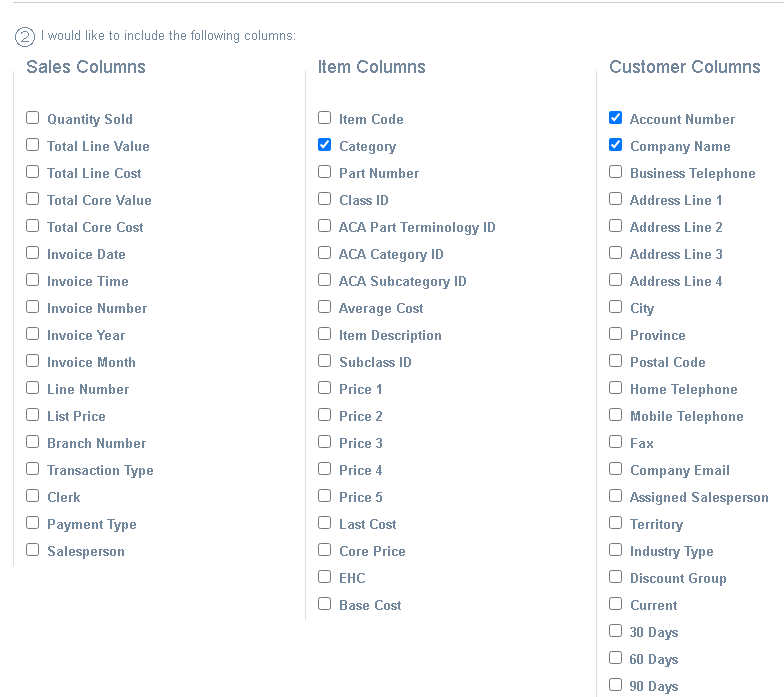
In Section 2, this is where you would select the pieces which you want detail on, and what the sales will be totaled by. In this case, Account Number, Company Name and Category. This means we will get a report by Account Number, Company Name and possibly Category

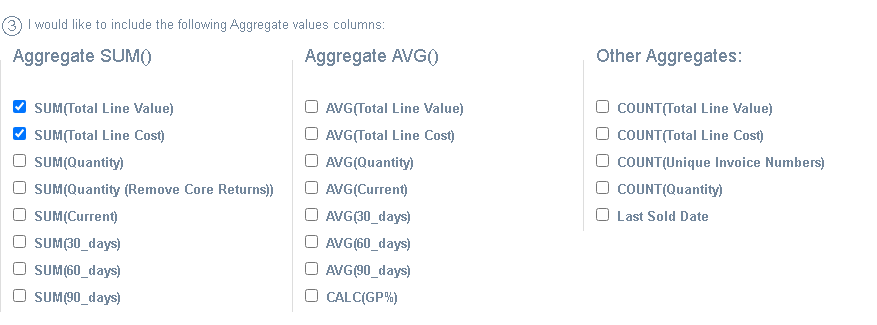
In Section 3, you pick what totals you want by Account Number, Company Name and Category. In this case, I am going to select SUM(Total Line Value) to get sales dollars and SUM(Total Line Cost) to get cost of sales. This means I will get a report on total sales and cost of sales by Account Number, Company Name, and Category.

Section 4 I'm going to pick a date range. In this case, I'm just selecting last month. Clicking on the calendar in the input field will bring up the calendar date picker.

Finally, in section 5, you can filter the data that will show. As of right now, I have a full report on Sales and Cost of Sales by Customer, Company Name, and Category. If I want to just return info on Brinks, this is where I would make that call-out by selecting to filter on Account Number.

Then, I just need to click the Generate report button and I will get a table below with the information I asked for.
If there are multiple pages, there will be page navigation at the bottom, and if you want to pull it out to excel you just need to press one of the export buttons at the top right of the table.
This is just a quick sample, dates can easily be adjusted and extra detail like category could be left off to get a more summarized total of the customer's sale, but it is a good idea of what you can get from the report generator.