Frequently Asked Question
The inventory dashboard gives you an overview of the value and breakdown of your inventory, on a per-branch or aggregate basis.
Window Switcher
The window switcher for the inventory dashboard allows you to select one or more of your branches to load the inventory data from.
Inventory Summary
The inventory summary consists of 4 tiles offering at-a-glance stats about the inventory data you have loaded. This includes:
- Inventory Cost
Sum of Average Cost * Quantity, per part
- Forecasted Annual Turns
Sales over past 12 months vs current value of inventory
- Currently Stocked Items
Unique count of items with stock > 1
- Items With Invalid Stock
Unique count of items with stock
Inventory Breakdown Graphics
Inventory for the current window is broken down into "top 10" graphics, categorized by:
- Category - Your system's internal linecodes
- Branch - Your configured branch locations
- ACA Category - Product classifications based on product vehicle fitment and the autocare association ACES standard.
- Old stock by category
Aged Inventory Summary
The inventory summary consists of 4 tiles offering at-a-glance stats about your inventory and it's aged valuation
- Current Stock
Items that have been sold or added in the past 12 months
- 12 Month Stock
Items that have not been sold in the past 12 months, but have been sold in the past 24 months
- 24 Month Stock
Items that have not been sold in the past 24 months, but have been sold in the past 36 months
- 36 Month Stock
Items that have not been sold in the past 36 months
Monthly Inventory Value
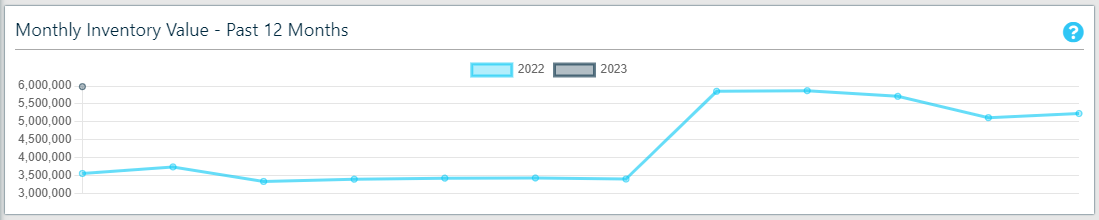
Displays the monthly inventory value (at average cost) by month for the past 12 months
Inventory Status
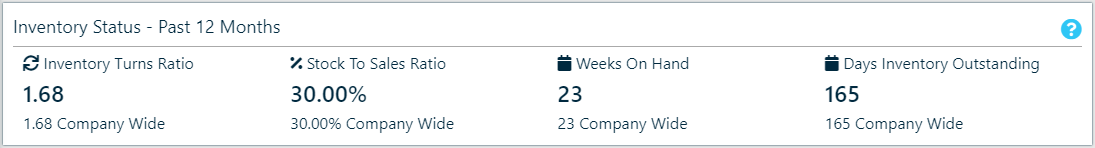
4 additional inventory status metrics
- Inventory Turns Ratio - calculated by dividing the cost of goods by average inventory for the same period.
- Stock To Sales Ratio - Average stock value / Net sales value
- Weeks Inventory Onhand - Accounting Weeks in Period / Inventory Turnover Rate
- Days Inventory Outstanding - (Average inventory / Cost of sales) x Number of days in period (365)
Historic Inventory Status
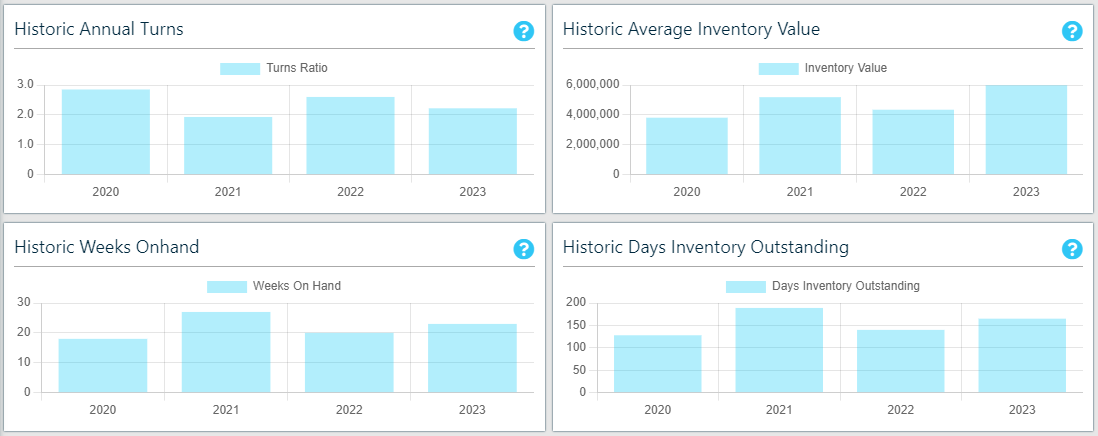
A set of 4 graphs displaying the historic values for the 4 inventory status metrics:
- Inventory Turns Ratio - calculated by dividing the cost of goods by average inventory for the same period.
- Stock To Sales Ratio - Average stock value / Net sales value
- Weeks Inventory Onhand - Accounting Weeks in Period / Inventory Turnover Rate
- Days Inventory Outstanding - (Average inventory / Cost of sales) x Number of days in period (365)
By year, for the past 3 years
Inventory Low Stock
The Inventory Low Stock table lists all of the parts within the current window that have what we consider to be "low stock". By default, the low stock threshold is (On Hand + On Order)
Inventory Old Stock
The Inventory Old Stock Table lists all of the parts within the current window that have not been sold in the past 24 months, as well as the quantity and overall inventory value of the parts.