Frequently Asked Question
Using the Dashboard - Dashboard
Last Updated 4 years ago
Dashboard
The JDispatch dashboard page provides you with a quick view of some key metrics on your delivery performance. These metrics are live and updated every 10 seconds.
KPI Cards
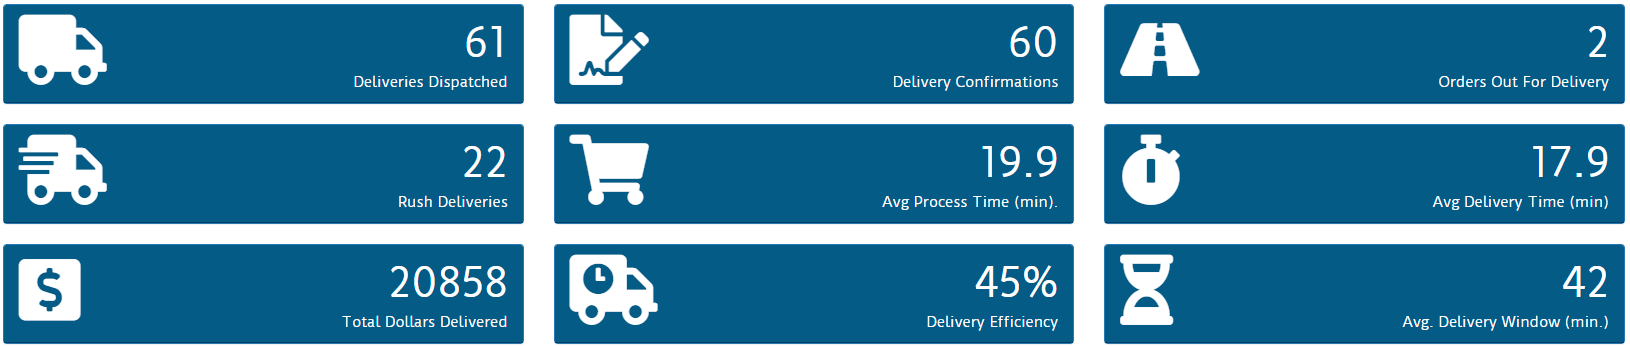
Quick-glance KPI cards are shown at the top of the page. The KPIs listed are :
- Deliveries Dispatched - Number of deliveries that have been dispatched with drivers today
- Delivery Confirmations - The number of delivery confirmations completed by your drivers today
- Orders Out For Delivery - The number of deliveries currently out with drivers
- Rush Deliveries* - The number of 'Rush' type deliveries dispatched today
- Avg Process Time - The average amount of time between when the order is taken and when the order is dispatched.
- Total Dollars Delivered - The total value of all deliveries confirmed today
- Delivery Efficiency* - The amount of deliveries that were confirmed within the optimized route ETA
- Avg. Delivery Window* - The average minutes between an optimized delivery ETA and when the invoice was delivered
* Denotes a premium user feature
Performance Graphs
Below the KPI cards are some basic performance graphs
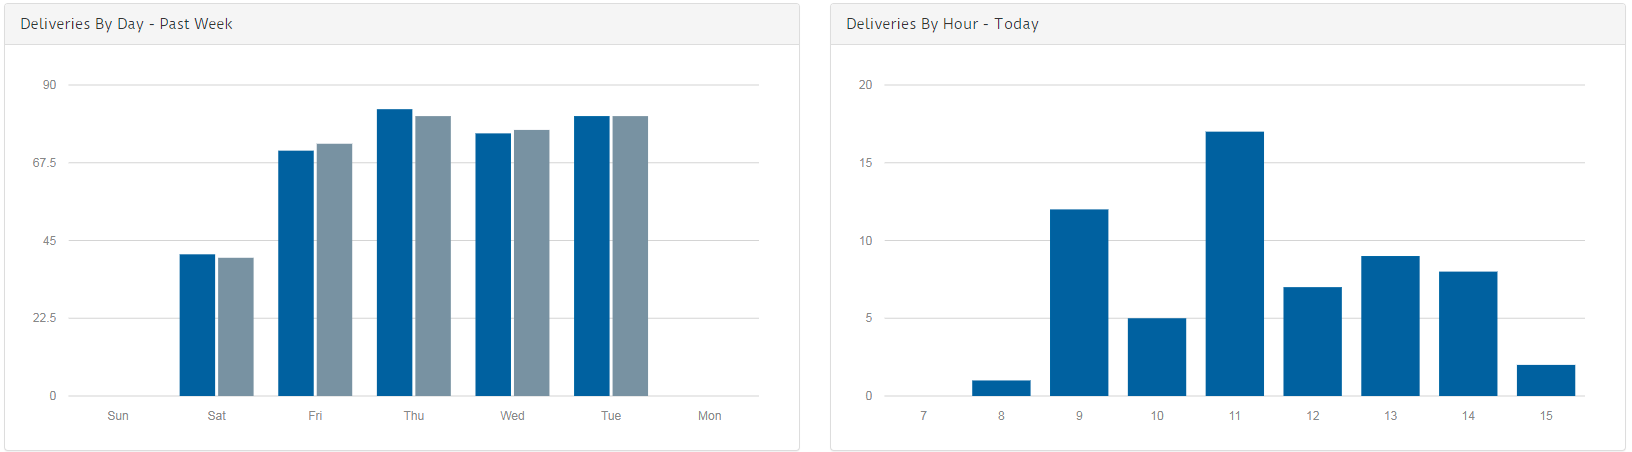
- Deliveries by Day - Lists deliveries and confirmations by day, over the past week, working backwards from today left to right
- Deliveries By Hour - Volume of deliveries, by hour, for today between 7am and current time.
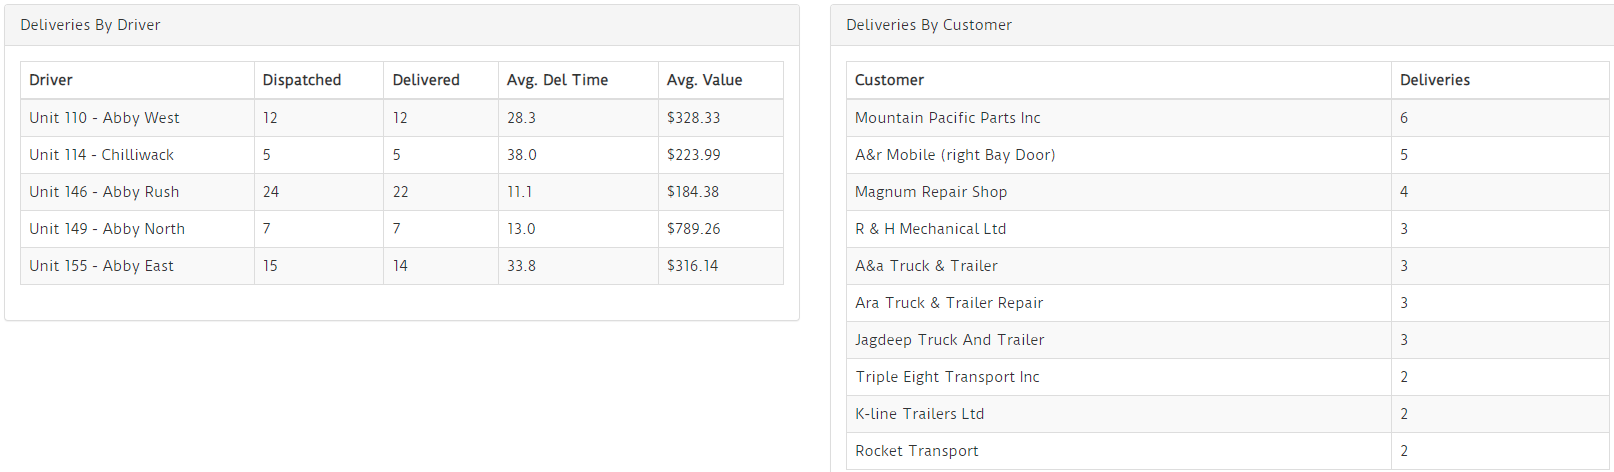
Performance Tables
After the graphs are two tables highlighting delivery volumes by driver and customer